andrew kim / projects / stock pitch model
a monte carlo valuation model i built for the jec invesco stock pitch competition. it simulates 100,000 five-year cash-flow paths for a company and gives back a whole distribution of fair prices, so the pitch could talk about a range and the odds instead of one number.
placed in the top three. invesco's judges called the model the strongest part of the pitch.
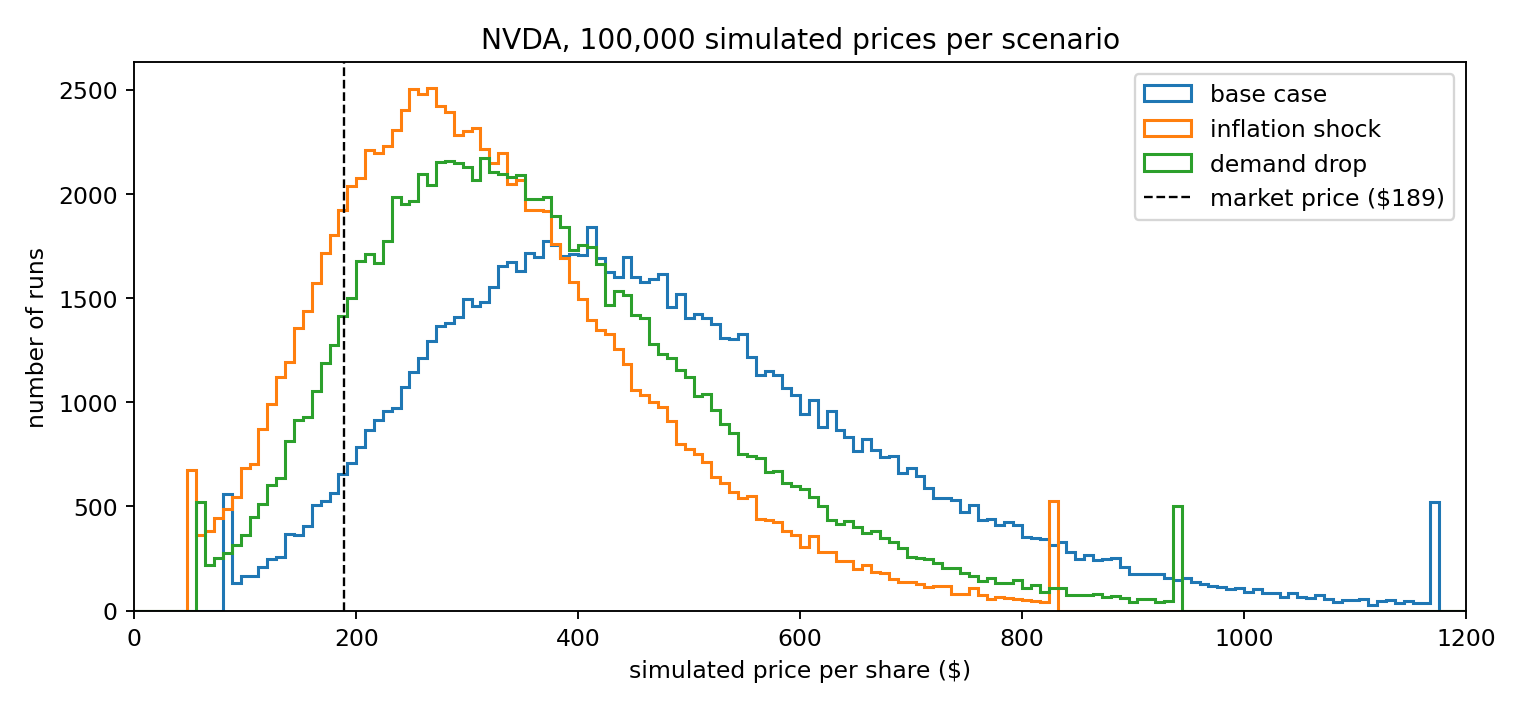
three scenarios
each run is a discounted cash-flow valuation, but every input that i'd normally have to guess is drawn from a distribution instead. those are revenue growth, free-cash-flow margin, the discount rate, and the terminal growth rate. the model runs three versions of the world, a base case, an inflation shock that raises the discount rate and squeezes margins, and a demand drop that cuts the first two years of growth, so the pitch could show how the company holds up when things go wrong.
def run_simulation(fund, scenario="base"):
    rng = np.random.default_rng(RNG_SEED)
    shape = (N_SIMS, N_YEARS)

    if scenario == "inflation":
        wacc_shock = rng.uniform(0.02, 0.04, N_SIMS)
        margin_shock = rng.uniform(-0.06, -0.03, N_SIMS)
    elif scenario == "demand":
        wacc_shock = rng.uniform(0, 0.01, N_SIMS)
        margin_shock = rng.uniform(-0.025, 0, N_SIMS)
    else:
        wacc_shock = rng.normal(0, 0.005, N_SIMS)
        margin_shock = np.zeros(N_SIMS)
    wacc = np.clip(fund["wacc"] + wacc_shock, 0.05, 0.25)

    growth = rng.normal(fund["hist_rev_growth_mean"], fund["hist_rev_growth_std"], shape)
    if scenario == "demand":
        growth[:, 0] += rng.uniform(-0.3, -0.1, N_SIMS)
        growth[:, 1] += rng.uniform(-0.2, -0.05, N_SIMS)
    revenue = fund["revenue_0"] * np.cumprod(1 + np.clip(growth, -0.6, 2), axis=1)

    margin = rng.normal(fund["hist_fcf_margin_mean"], fund["hist_fcf_margin_std"], shape)
    fcf = revenue * np.clip(margin + margin_shock[:, None], 0.01, 0.7)

    years = np.arange(1, N_YEARS + 1)
    pv_fcf = (fcf / (1 + wacc[:, None]) ** years).sum(axis=1)

    tg = np.clip(rng.normal(fund["terminal_growth"], 0.005, N_SIMS), 0.01, wacc - 0.005)
    tv = fcf[:, -1] * (1 + tg) / (wacc - tg)
    pv_tv = tv / (1 + wacc) ** N_YEARS

    price = (pv_fcf + pv_tv - fund["net_debt"]) / fund["shares_outstanding"]
    lo, hi = np.percentile(price, [0.5, 99.5])
    return np.clip(price, lo, hi).astype(np.float32)
it's all vectorized with numpy, and it uses a fixed seed, so the same inputs give the same chart every time. there's also a faster screening version that runs a lighter valuation over every s&p 500 tech and communication stock and ranks them by upside.
download the model and the deck (989 kb zip)